
Recently I took a look at Grafana Cloud for a side project. The free tier covers my needs and for something that works, I’m happy to pay a reasonable price and have weird hostage feelings about relying on things that come for free. Grafana Cloud offers a tremendous number of features, but be warned, you will need to get your hands dirty and tweak config files a fair bit before you get your idyllic environment. I found some niggles, like I’d go back to the dashboard to find a graph title had changed randomly, or the chosen labels for a series suddenly had changed in the graph config. I get that data sources can be noisy, but some issues came from bad UI state being pulled and saved as opposed to my data feeds screwing things up. One for Grafana’s engineering team. Grafana requires some time investment to get the best out of it, but I was lucky to have worked with it in the past and getting to a meaningful outcome was relatively straight forward.
The architecture of my project is very simple and consists of binary that contains API logic and a single config file for providing credentials for services like databases, object stores and third-party APIs for data verification. I could split this logic out into Lambdas especially as of April 2022 AWS Lambdas support HTTPS URLs. User experience however is key, even for these pet projects and so virtual machines that are always on provide simplicity, predicable cost and the always on response times of an efficient APIs service. I still use Lambdas for dealing with webhooks and monthly events such as metadata summary record generation, but they don’t sit in the fast path of user experience. I don’t need containers, Kubernetes or the other incremental technologies either. My ideal jump is from monolith API service to atomic FaaS components. Until that landscape is simpler, I’m stuck with the needs of my ops model, which means accessing a dashboard on a mobile device if things go wrong and receiving a low number of meaningful alerts.
- Meaningful logs in one place.
- Go run time metrics on a graph.
- Application metrics on a graph.
- CPU and Memory consumption on individual graphs.
- Alerting when the service restarts, terminates or a graph has an out of trend spike.
If I add more virtual machines (because there might be eleven users?) then the new metrics should appear on the existing graphs and I shouldn’t have to go back to the ops system to add data.
These pet projects can become huge distractions and so from the beginning, some data self-expires and Lambdas convert lots of records to summary data at the beginning of each month prior to the data expiration. Even the summary data expires after 12 months and so there is little to do in terms of management, other than making sure the services are alive and that the data volume stored in objects and the database is aligned with the API activity. It’s a take on NoOps and I figure everything I don’t have to do, is a win.
Grafana Cloud
Thanks to some previous experience, I’m familiar with most of the tools from Grafana Labs. Experimenting with their Cloud offering was a no brainer. There are some limitations however you should be aware of and the Grafana Cloud UI needs to make more of a point about what you cannot and can do if you’re used to coming from traditional environments.
The Grafana toolset effectively leaks through labelled data sets and then provides a means of extracting fields from that labelled data. I found it infuriating that when I wanted to extract fields from a label, that I could choose either JSON or automatic parsing, but couldn’t provide a regular expression. Much fist shaking at the screen. You will also rely on a number of transformations to do things like merging data sets or organising fields in noisy data sets. The real annoyance was overrides on the graph panel component to rename series on the graph legend. This should be a simple transformation or even part of the query itself. I don’t know why they removed the Alias capability (or never added it?).
Despite my moaning, there are a huge number of positives.
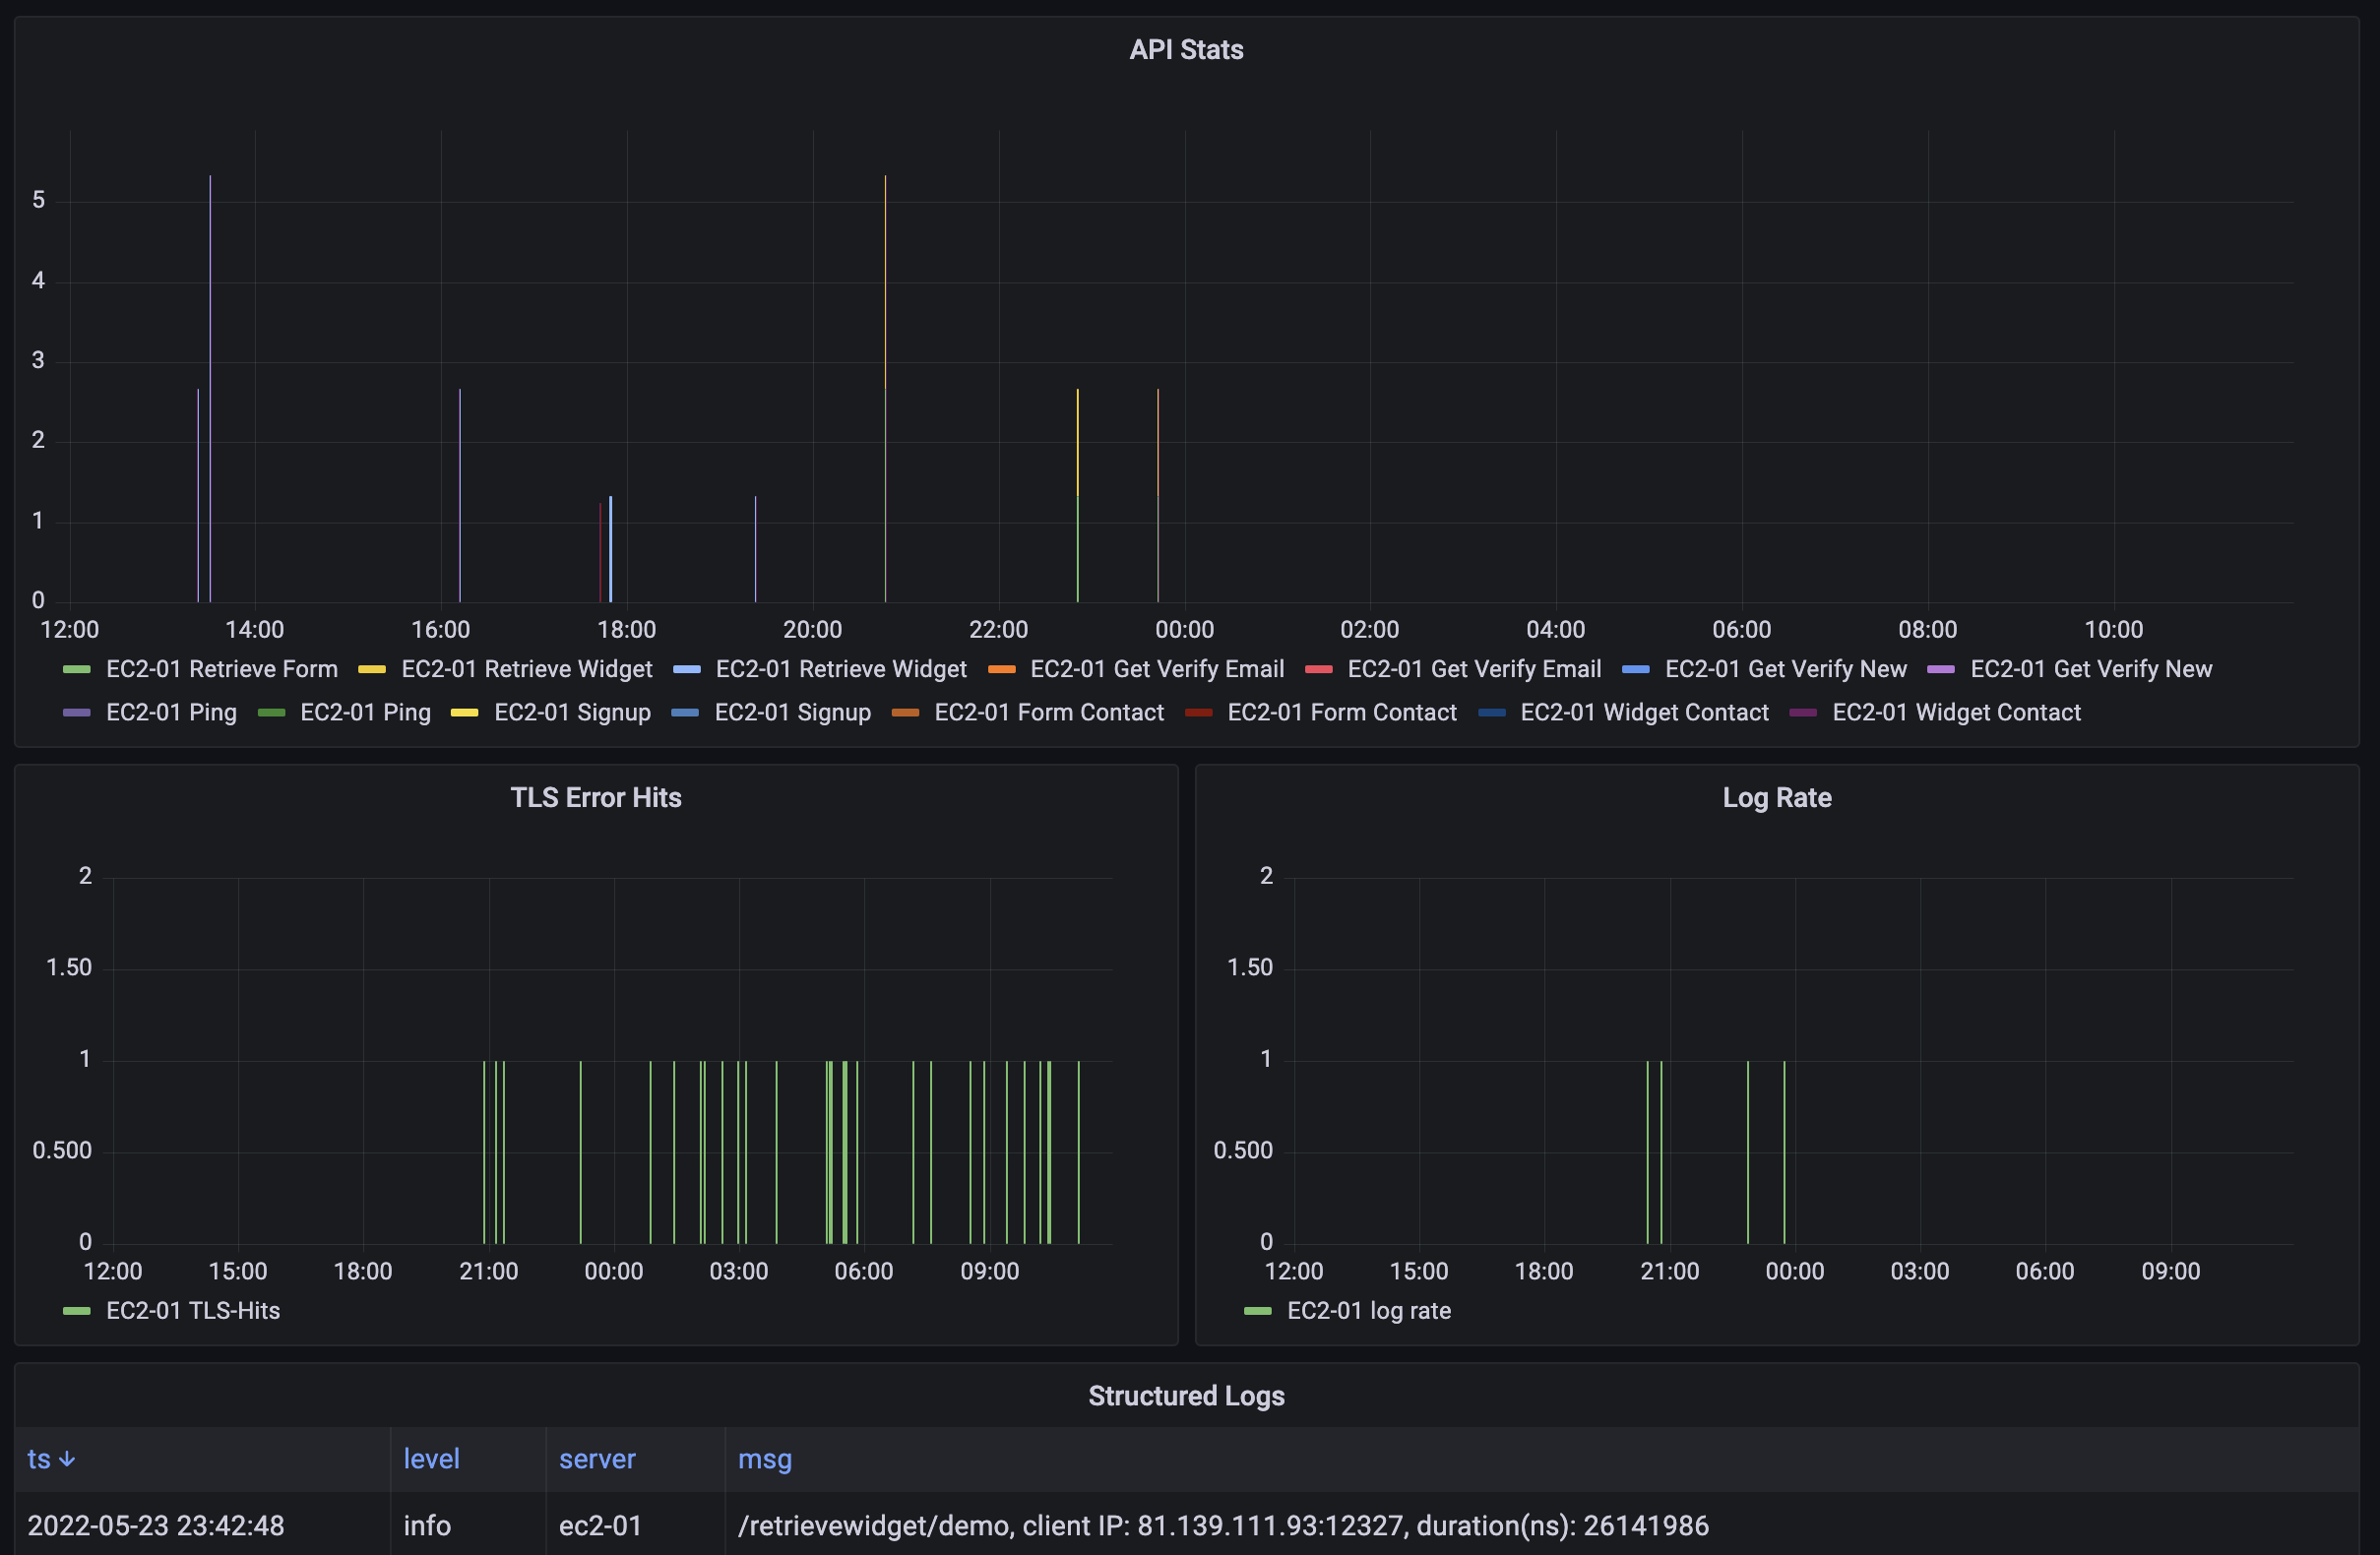
Loki is the log aggregation and handling platform for Grafana Labs. It can handle an enormous number of logs and those things arrive blisteringly fast. The team go into some detail on how they do this here, but just know, the time from log extraction to displaying it on a table or log feed is negligible. Even with the additional transformations or conversions that take place, it’s bloody quick. What I found irksome about Loki is you need a log exporter like Promtail, which pulls logs from /var/log/* or the systems journal. I played around with a Go package to put data into Promtail via an HTTP call directly (thus to avoid the journal), but the I couldn’t get it going and gave up after 30 mins or so. Perhaps it’s the fact the code is under change. Lots of the Grafana Cloud capabilities are labelled as alpha and beta, so expect some flux as things mature. You can use LogQL to do things like log filtering and zone in on the important stuff and then Promtail has its own config system which you can create ETL pipelines in. I found it a bit tedious to test, but it’s quite powerful. You can add labels to various parts of the pipeline and for example, you can have a server label identifying the source host for a data set and in addition something specific like a unit label identifying data from a unit within journal, or even handle logs that don’t parse well like uncaught exceptions which you can label with something meaningful. This is an interesting point and the intersection between ops and development is noteworthy. I’ll come back to this later.
Another gain from Grafana Cloud is the Prometheus handling. I love Prometheus and always have done. It’s an easy to debug method of extracting metrics from a system and it works beautifully for normalising those metrics across a system. What I mean by that is, a single Prometheus instance on a virtual machine can provide Go run time metrics, your custom application metrics and system metrics such as memory usage and CPU activity, all in the same style of consumption. It does mean you have to provide a scraping endpoint on your API such as /metrics and handle authentication for that especially on a public internet facing system, but it’s joyous when you have a single way of grabbing and handling metrics, sourced by a virtual machine and the constituent services. Grafana Cloud is just another remote write endpoint for Prometheus and again, it’s simple to get going because the Grafana Cloud dashboard provides you all the information you need.
Intersection between Dev and Ops
There is a time and financial cost to building systems that result in operational efficacy differences. I recall a conversation with Bill Kennedy some years back on this topic when something is an operational responsibility vs that of the developer. My belief has been that whatever you create should be easy for ops to setup, but there has to be Design Thinking drivers where those two teams or people agree on patterns prior to the developer committing to anything. If you are both dev and ops, then have a chat with yourself as the developer and as the operator. I promise it will be revelational as you try to crap on yourself from different angles.
Where I’m going with this is, what’s cheaper? To handle manipulating some unformatted data in the ops pipeline or rewrite code that works perfectly well for the consumer to make it easier for ops? If the conditions are known and the ops pipeline can handle it, should it? It’s a question of opportunity cost and ops suitability.
Let’s take an example. This Go code should be fairly recognisable if you write Go. It usually runs as the last call in your main.go or in a Go routine. The issue with this method is that when it logs errors, it does so to std out without any control of the format. Where I use the logging pattern explicitly in the key=value style, the call below dumps raw text out. There is a whole thread on this on GitHub if you’re interested: https://github.com/golang/go/issues/38877.
err := http.ListenAndServeTLS(blah blah)
So, what do I do? Put time into rewriting the ListenAndServeTLS method and ensuring it’s reliable, or do I just regex the logging patterns of the default service and label it in the ops pipeline? I went with the latter, because the mental and time cost of handling it was negligible. If this was a commercial project, then I’d probably go with the code modifications, but it isn’t a crime to take the path of ease and as long as I’ve documented what’s happening and where, no one is going to die. More to the point, as the dev and the ops for this project, I can handle the cost.
These conversations should happen more I believe in product teams. There is a synergy to be had when the expertise of Ops meets that of Dev need and workload. Moving on!
Architecture Overview
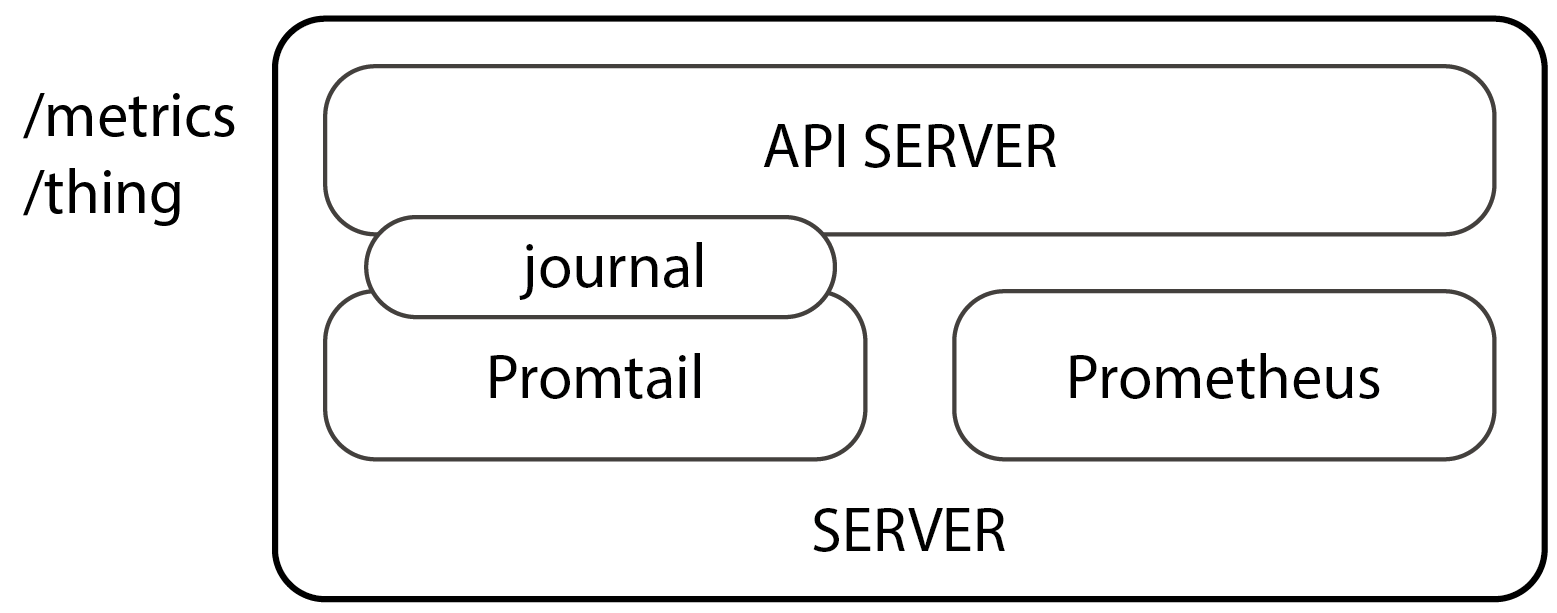
The architecture of my deployable virtual machine is relatively simple.
- Service specific API binary runs as a
systemdservice. Sorry haters, it just works. - Promtail (the Loki log exporter) runs as a
systemdservice with its own config. - Prometheus (metric exporter) runs as a
systemdservice with its own config.
Promtail pulls logs from the journal. Prometheus scrapes itself for the system metrics and it scrapes the /metrics endpoint on the service specific API on the same machine using an auth token processed by the API middleware.
In previous pet projects, I dumped logs out to CloudWatch, but using the AWS console as an ops tool was a stupid idea. Also it can be pricey because it’s consumption based. I triggered a bug some time back and blew through my monthly budget in minutes. Eee. For logging and ops, I prefer fixed costs, so ditched this method and burnt the code. Grafana ticks my boxes for this need alone!
It strikes me sometimes as odd that for a single and simple API binary service running on a virtual machine, the ops overhead is much bigger. However, this style of deployment is friendly for pet project deployment sprawl. None of my pet projects are resource heavy and so it means I can use the same pair of virtual machines as deployment targets. As each new service is added, the Promtail and Prometheus config files can be redeployed by a CICD pipeline and ops setup becomes ‘cheap’. Bottlenecks in my designs are always databases or upstream services that my backend code consumes and so as long as I have resouce breathing room, I can comfortably run many services on a single pair of compute instances.
Regarding ops, there are two types of deployment for this style of architecture. One is scale-up in which case more services are deployed to cope with load in which case the dashboard automatically includes the metrics thanks to simple use of data labels service and server. The other is the introduction of new services, in which case, I need to build new dashboard graphs to handle the new metrics being emitted by Prometheus and a new scraper endpoint for Prometheus. I won’t need to touch Loki however providing I stick with the labels currently in use. The data will automagically appear in the tables!
If you’re considering how to automate all of this, the server side can be handled by a simple CICD platform on something like CircleCI, but the dashboard changes are a one-time effort. If you have a team, the developers could provide you a JSON config file for Grafana as part of your CICD process, in which case you could programmatically change Grafana Cloud’s dashboard. I don’t know if this is possible today. I suspect because the UI can do it, the answer is yes, but I don’t know specifically how. If you’re interested in this, start with inspecting how the UI does it in the background and replicate it? There is a Grafana Cloud API doc which is a good starting point: https://grafana.com/docs/grafana-cloud/reference/cloud-api/. You can always reach out to the Grafana Cloud success team for information like this.
Outstanding Desires and Gripes
-
I want to log directly to Loki without Promtail running as a
systemdservice. -
I want Grafana Cloud Prometheus service to scrape my public API metrics endpoint without Prometheus running as a
systemdservice. -
I responded to one of two automated welcome emails from a named person in the Grafana Labs customer success team, offering to give some feedback of my experience so far. Not long after I got a ticket raised by someone with a different name, asking me to email CS to setup a conversation. I won’t be doing that. It had me thinking is it Customer Support or Customer Success? A product like theirs is complex with lots of moving parts. Passive support behaviours won’t cut it.
-
I need to work on the rate function for Prometheus metrics on the graphs. I’ll spare the details for the sake of the blog post, but anyone who’s got keen eye balls will notice the numbers are not whole.
Wrap
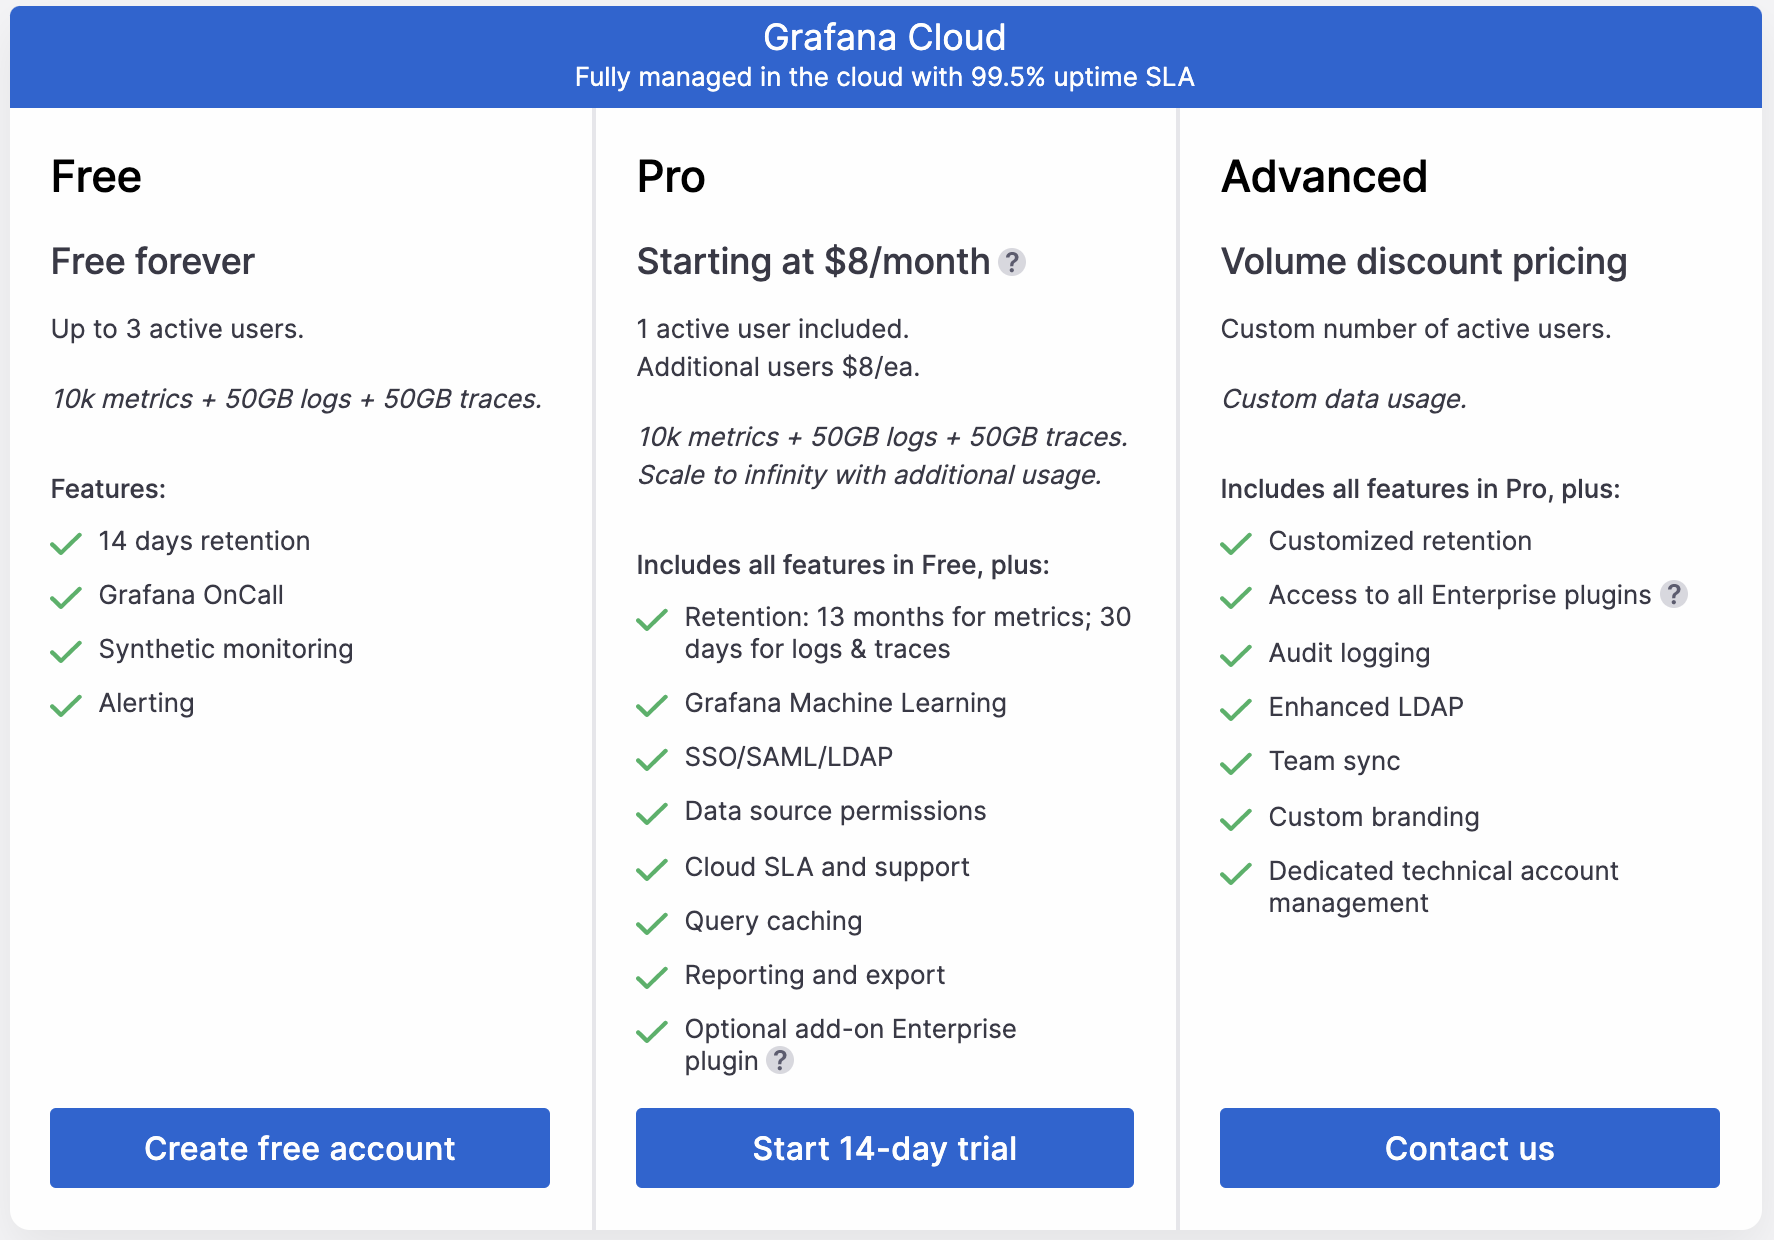
My ops dashboard is simple and useful and I can investigate weird spikes and can cast my eyes over the graphs for patterns. I don’t use ML (not enough data) and alerting will be setup soon for catastrophic issues or API errors. I will stick with Grafana Cloud and will convert to a paying customer to gain longer data retention, support and ML for when I have enough data to train a model. Their customer support isn’t off to a great start, but their offer meets my current needs and Grafana is one of my comfort blankets. Even the smallest long-lived projects need operations dealt with. It doesn’t have to be ground breaking or hard. Grafana Cloud meets my fundamental expectations today and I’m hoping as the industry continues to embrace FaaS and serverless, Grafana Labs meets it head on.
You can sign up for 14 days free and if you feel like doing just that, here’s my referral link: https://grafana.com/auth/sign-up?refCode=gr8e78y9g3EEyPa